Introduction
Introduction
Monitoring is important because it can help you identify problems early, track performance, and ensure that your systems are operating as expected. There are many benefits to monitoring, including saving time, money and avoiding customer dissatisfaction. To get started with monitoring, you will need to choose a monitoring tool, collect metrics about the most important aspects of your systems applications, and set up alerts so that you are notified when problems occur.
Now I will try to explain to you what the basics of monitoring are, why you should use it, and what you need for monitoring.
What is Prometheus?
What is Prometheus?
Prometheus is an open-source monitoring and alerting toolkit originally built at SoundCloud. It is a highly scalable monitoring system that can be used to collect metrics from a wide variety of systems and applications.
Overall, Prometheus metrics are an essential tool for monitoring your systems. They can help you identify problems early, improve performance, meet compliance requirements, and gain insights into your systems.
Prometheus Metric Types
Prometheus Metric Types
- Counters: Counters are metrics that can only increase or reset to zero. They are typically used to track things like the number of requests, the number of errors, and the number of bytes transferred.
- Gauges: Gauges are metrics that can go up and down. They are typically used to track things like the current memory usage, the current CPU usage, and the current number of concurrent connections.
- Histograms: Histograms are metrics that are used to track the distribution of values. They are typically used for quantiles of request latencies, and response sizes.
- Summaries: Summaries are similar to histograms, but they also track the minimum, maximum, and average values. They are typically used to track things like the latency of requests, the size of responses, and the number of errors.
These are the basic properties of metric types, I will give examples of how we use these metric types again later in the post.
What If We Don’t Get Application Metrics?
What If We Don’t Get Application Metrics?

Visibility is key to project success. Without it, troubleshooting and ensuring expected performance is difficult. That’s why SLAs and SLOs are important. They define performance and availability expectations and keep everyone on the same page. SRE teams can more effectively prevent problems, identify, and fix them with clear SLAs and SLOs. Also, we need to collect the metrics to estimate the SLA and SLOs.
Prometheus metrics provide visibility into the inner workings of our systems. They allow us to track things like the number of requests, the latency of requests, the memory usage, and the CPU usage. This information can be used to identify problems, troubleshoot issues and optimize performance.
If we don’t collect Prometheus metrics, we will be blind to what’s happening in our systems. We won’t be able to see if there are any problems and we won’t be able to take any corrective action. This can lead to outages, performance degradation, and other problems.
For example, if we want to do a load test on our application, we will never be able to understand how the services are bursting, resource utilization, etc., and the load test we do will be meaningless.
Therefore, it is essential to collect Prometheus metrics for monitoring our systems. This will give us the visibility we need to keep our systems running smoothly.
What is Prometheus Exporter?
What is Prometheus Exporter?
Exporters are required to collect metrics from a source that does not expose Prometheus metrics by itself.
Prometheus exporters are tools that Prometheus uses to collect metrics. Exporters expose metrics in a format that is compatible with Prometheus, which allows Prometheus to monitor them and generate alerts.
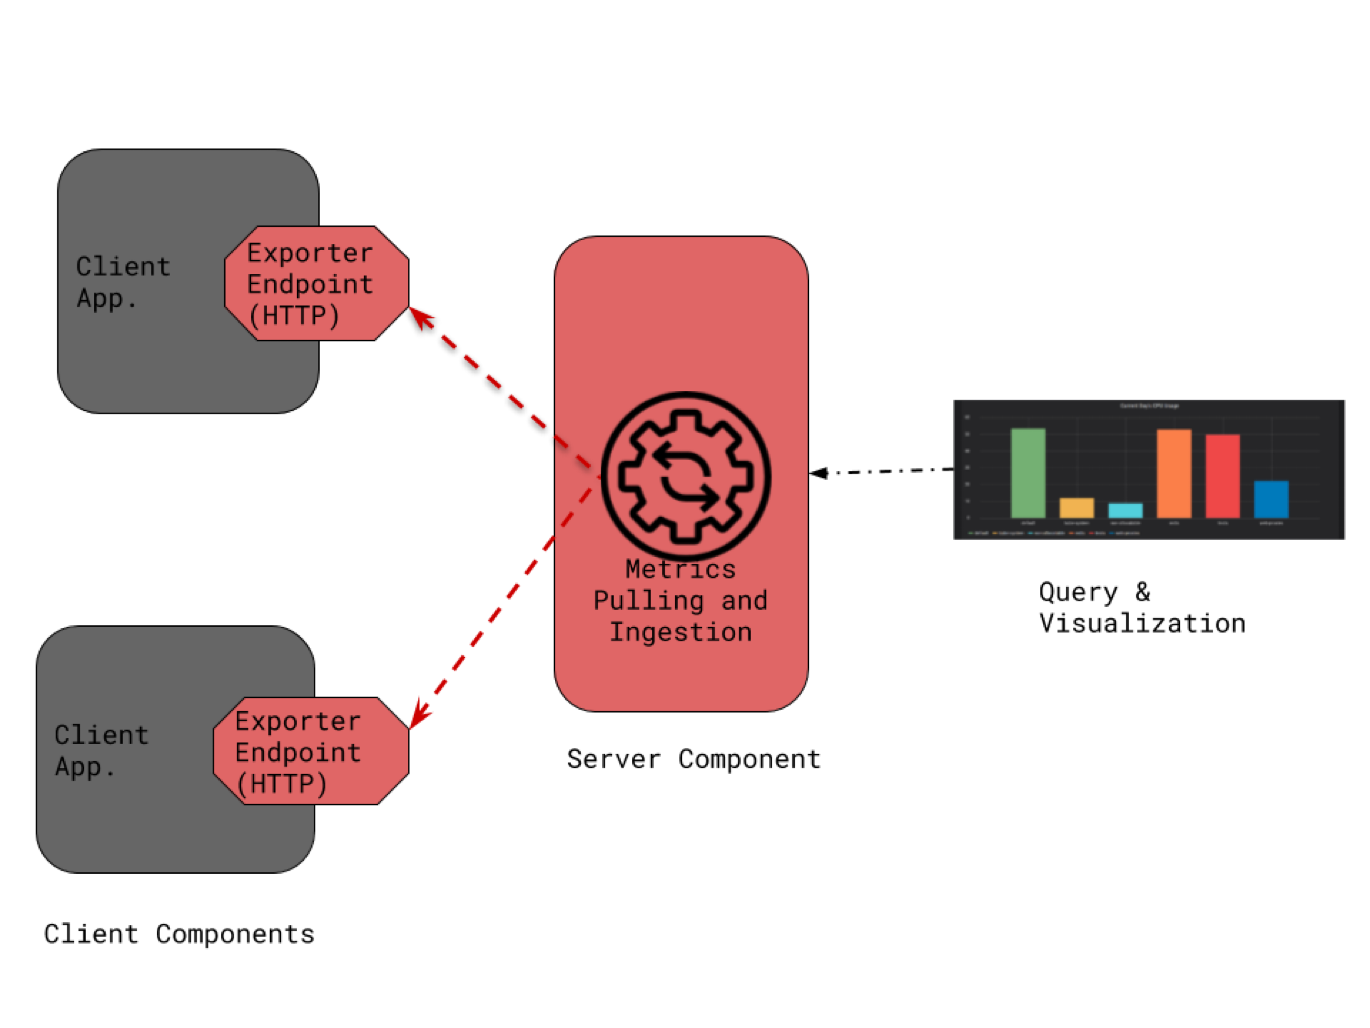
How Exporters Work
Prometheus Exporters acts as a proxy between applications and the Prometheus Server. Exporters pull metrics overtime via the application’s protocol for metric collection.
Exporters can be used to extend Prometheus monitoring capabilities. For example, Prometheus can use the HTTP exporter to monitor the performance of websites, the MySQL exporter to monitor the performance of databases, and the application exporter to monitor the performance of applications.
Exporters are a powerful tool that can be used to extend Prometheus monitoring capabilities. They are easy to use and can expose metrics from a variety of sources.
PromQL
PromQL
PromQL is a query language that Prometheus uses to select and collect time series data in real time. PromQL allows users to establish relationships between different time series measurements and create complex metrics. This helps users to better understand their systems and identify potential problems more quickly.
PromQL is an important feature that makes Prometheus a powerful monitoring tool. If we look at a simple PromQL example;
avg_over_time(node_memory_Active_bytes[2m])/1024/1024/1024It calculates the average value of the node_memory_Active_bytes metric over a time window of 2 minutes and it converts the average value from bytes to gigabytes by dividing it by 1024, 1024, and 1024.
PromQL is a complex topic, so I have provided a brief overview for those who are unfamiliar with it. For more information, you can visit the website.
GRAFANA
GRAFANA
Grafana is a powerful data visualization and monitoring platform that can be used to monitor the performance of systems, detect application errors and analyze data.
Dashboard Examples
Dashboard Examples
Gauge
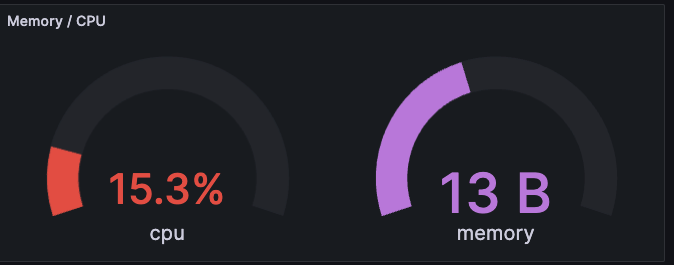
Gauge
As we mentioned at the beginning of this article, A Grafana gauge is a bar that represents a specific range of values. The gauge shows the upper and lower limits of the value range and the current value. Gauges can be used to monitor the performance of a system or the status of an application. Mostly we use gauge metric type in CPU and Memory Usage, Network Count, etc.
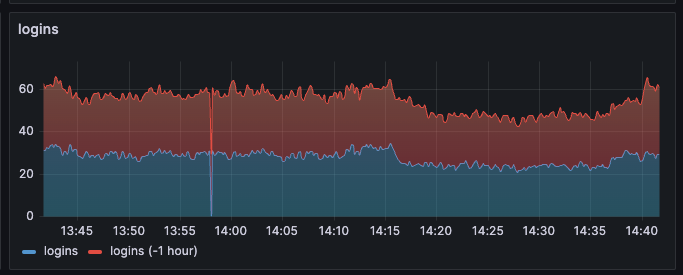
Time Series
Time Series
Time series visualizations are important in Grafana because they allow you to see how your data changes over time. This can be useful for a variety of purposes, such as monitoring the performance of your systems or applications, identifying problems, or determining performance trends.
Besides the Default dashboards that come with Grafana, we can create our dashboards according to the needs of the application. To create effective dashboards, we need to identify the most important metrics for our needs and design dashboards that are simple and easy to understand. For this, we need to choose the appropriate metric and the appropriate metric types (gauge, histogram, etc.).
For more examples, you can visit the Grafana Play Home site, created by Grafana here, where you can play with dashboards as you like and see the many different features Grafana provides.
Also here you can see the dashboards created by the community
Alert Manager
Alert Manager
Alertmanager is a tool that receives alerts from Prometheus and sends them to configured receivers. It can deduplicate alerts, group them together, and route them to different receivers based on their severity or other criteria. Alert Manager also provides a web UI for viewing and managing alerts.

There are 3 essential features that Alert Manager provides;
- Grouping: Grouping categorizes alerts of a similar nature into a single notification. This is especially useful during large outages where many systems may start failing at the same time and hundreds to thousands of alerts may be triggered at the same time.
- Inhibition: It is the concept of suppressing notifications if there are already incoming alerts. For example, an alert comes in that an entire cluster is unreachable. Alert Manager can be configured to mute all other alerts related to this cluster if that alert is coming in. This prevents notifications for hundreds or thousands of alerts that have nothing to do with the actual problem.
- Silences: Silences are a simple way to mute alerts for a certain period of time. For example, we can silence an alert if we know it is coming and is not a problem, but it should be deleted if it is not needed.
name: NodeCPUUtilizationHighexpr: instance:node_cpu_utilisation:rate5m * 100 > ignoring(severity) node_cpu_utilization_percent_threshold{severity="critical"}for: 10mlabels: severity: criticalannotations: description: The node CPU utilization ({{ $value }}%) has been over threshold ({{ query "node_cpu_utilization_percent_threshold{severity=\"critical\",instance=\"$labels.instance\"}"}}%) for 10 minutes.summary: Node CPU Utilization is high- name: This line defines the name of the alert.
- expr: Defines the expression that is used to trigger the alert. The expression checks if the CPU utilization for the specified instance has been over the critical threshold for the past 10 minutes.
- for: Only if CPU utilization is high for 10 minutes or more, an alert is triggered.
- labels: Defines the labels that will be associated with the alert. The tags are used to categorize the alert and to make it easier to filter alerts in your monitoring dashboard.
- description: This line defines the annotations associated with the alert. The annotations are used to provide more information about the alert, such as the value of the CPU utilization that triggered the alert and the threshold that was exceeded.
- summary: The summary provides a brief overview of an alert. It includes the alert’s details, such as the value of the threshold that was exceeded and the duration of the alert. The summary can help you understand the alert more easily and take appropriate action.